Document Notion databases With ER models in Mermaid

Everyone’s favorite “no-code” tool, Notion, can get surprisingly complex. To understand a template, users have to click on relations, rollups, and formulae, just to get the big picture of how things relate. There’s a better way. We can create a visual diagram showing all the tables, relationships, and calculations and maintain it with Notion.
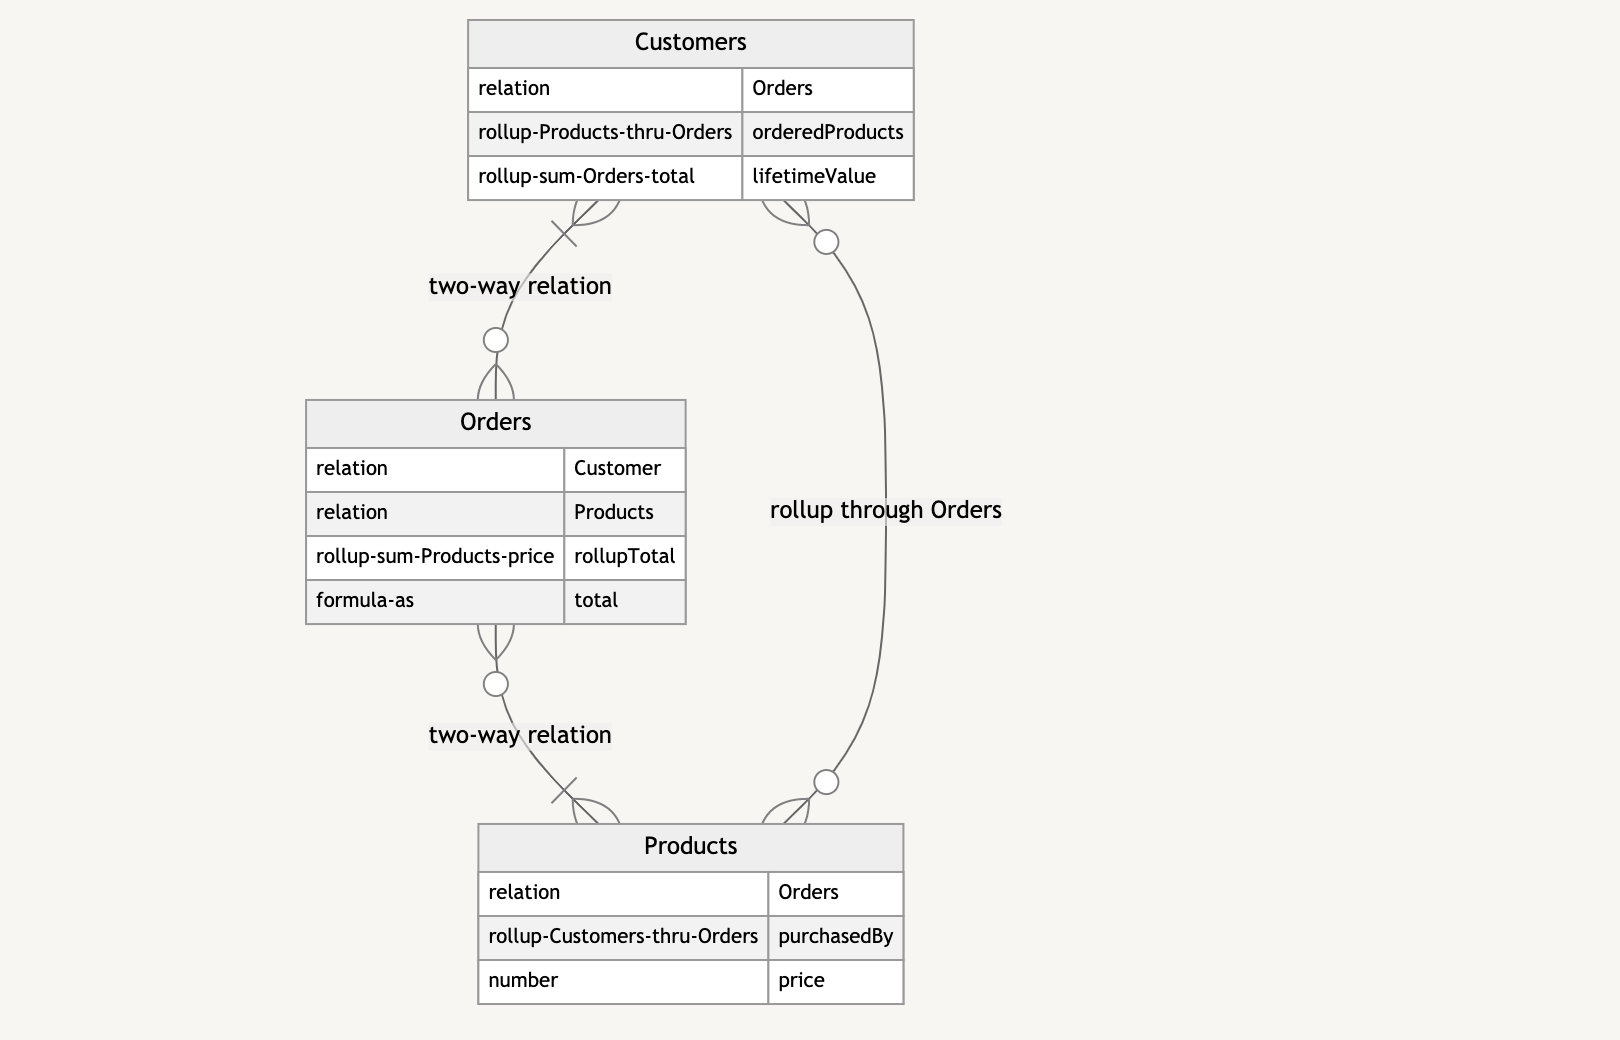
Demo time! Let’s use the quintessential example: Customers place Orders for Products.
Mermaid lets you create diagrams and visualizations using a markdown-like plain text syntax. Notion supports Mermaid. Add a code block on your docs page and set the language to Mermaid.
Entity-Relationship Models are often used in software engineering: imagine whiteboards full of boxes and arrows. We’ll use just enough to show the big picture of our complex Notion database.
Define the entities. By convention, I first letter cap the databases Customers, Orders, and Products.
Establish relationships. Notion uses the Relation property type to hook up databases. These might be one- or two-way — Products appear on Orders and Orders are displayed on Products, too. Although Notion can’t enforce it, it’s worthwhile to consider the relationship type: an Order has to have a Customer, but a Product might not have an Order. These one-or-more, zero-or-more relations create charming links between entities called Crow’s foot notation. 🪶
Define formulas as attributes. You can add formulas as attributes to entities, using type and name. So on Orders, I create a Notion property called “Rollup Total,” and document it as rollup-sum-Products-price. That calculates the order total from the sum of the Products prices. On Products, I document “Purchased by” as rollup-Customers-thru-Orders.
The complete documentation looks like this:
Download a copy of this Notion template and click on the Colophon to see the documentation diagrams. Let me know if you find this helpful!